In this article we are going to explain what the Johari window is and how to use it in your organization to promote self-analysis and improve communication among the members of your organization by creating a map of strengths and areas for improvement personalized for each employee.
Table of Contents
1 The Johari Window
The Johari window is a useful cognitive psychology tool for getting to know ourselves and our relationships with others. It takes its name from its creators, the psychologists Joseph Luft and Harrington Ingham, who created it in the middle of the 20th century with the purpose of creating a tool to analyze the dynamics of personal relationships. Its applications are very diverse, and it is widely used in group dynamics and coaching techniques to improve our capacity for internal analysis and communication.
The Johari window collects for a series of personal aspects the vision that "oneself" has and that of "others". Taking into consideration the answers obtained, it classifies the evaluated aspects into 4 quadrants or areas:
-
Public Area. Those aspects that others and I know about me.
-
Blind Area. Those aspects that others perceive in me and I do not know.
-
Hidden Area. Those aspects that I know about myself that others do not.
-
Unknown Area. What neither I nor others know about me.
2 Map of strengths and areas for improvement
One of the applications that the Johari window has is to obtain a map of strengths and areas for improvement in the professional or work environment. It will allow us to better manage the talent of our team, and we will obtain benefits that will have an impact both on the personal development and satisfaction of each employee and directly on the day-to-day of the organization.
With Hrider the map of strengths and areas for improvement can be easily included in a performance evaluation or in any other type of feedback process enabling it with a simple click:
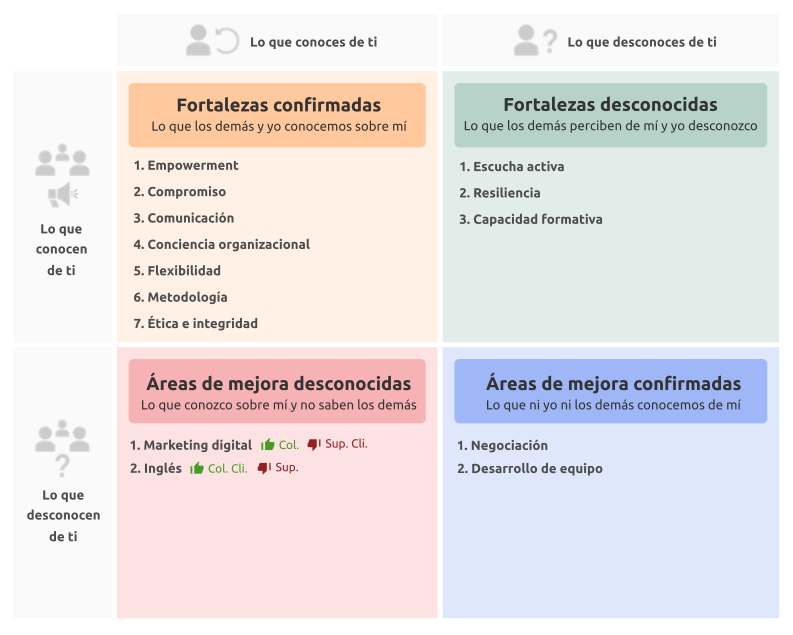
The map has two columns, the first "What you know about yourself" which includes the aspects that you see in yourself as present, and the second column "What you don't know about yourself", which includes those aspects that one does not consider as acquired.
In a similar way, the rows collect the vision of "the others". The first "What they know about you" includes the aspects that others see in oneself. And the second is "What they don't know about you", the aspects that others don't perceive in you.
Based on the previous logic, the map is made up of four quadrants in which each of the indicators or competencies evaluated is distributed:
-
The Confirmed Strengths quadrant shows those indicators or competencies that both the person evaluated in their self-assessment, as well as other professionals with whom they interact (supervisors, colleagues, subordinates, clients), evaluate above or equal to the level considered as required. They are therefore strengths recognized by all that develop normally.
-
The Unknown Strengths quadrant shows those indicators or competencies that the evaluated person themmself, in his self-assessment, does not perceive as his own but that the other professionals with whom he interacts do consider as acquired.
These indicators are an opportunity for growth for the evaluated person who can be more aware and enhance those aspects that he believed were not acquired.
-
The quadrant Unknown areas for improvement incorporates those indicators or competencies that the evaluated person considers he has but the rest of the evaluators do not perceive as such.
Identifying these indicators or competencies is an opportunity to establish personalized training plans and convert these aspects into confirmed strengths later in the short term. It can also indicate a possible communication problem between the team that we must try to solve.
-
The Areas of confirmed improvement quadrant incorporates those indicators or competencies that neither the evaluated nor the other evaluators consider acquired.
These indicators or competencies can help us create better training plans that improve the performance of the appraisee, but they can also indicate that it would be convenient to change the professional profile of the appraisee to perform other competencies more in line with their abilities.
3 How to make a map of strengths and areas for improvement
If you have a feedback or performance evaluation with HRider in which the evaluated person themself participates with their self-evaluation and some other role, supervisor, colleagues, subordinates or clients you don't have to do anything! Access the personal report and two maps will appear automatically, one by groups of indicators and another by individual indicators.
If not, we will explain the steps you have to follow to implement a simplified version of the map of strengths and areas for improvement that you can implement manually:
-
Write a set of personalized indicators or competencies for each job position that the employee must have to exercise their performance adequately.
-
Select for each indicator a number of degrees of compliance. For example, you could use the scale: "Insufficient", "Regular", "Good", "Excellent", and write down which of them is considered the minimum essential for the position. It is important to be honest and not demand a degree that is unachievable or unrealistic.
-
For each person, select a group of people who can evaluate their performance. For example, you can select a supervisor, two colleagues, two subordinates, and two internal customers. If this is the first time, or your organization is not used to receive and give feedback, it may be more advisable to start with a few evaluators and gradually increase them in successive evaluations.
-
Distribute the previously selected indicators or competencies to the person being evaluated and to the rest of the evaluators, and ask them to indicate what degree of compliance they believe best suits the performance of the evaluated person.
-
Collect the answers and for each indicator:
-
Check in the self-assessment if the selected grade is equal to or higher than the minimum required grade. If so, we will place the indicator in the quadrants of column 1, otherwise we will do it in one of the quadrants of column 2, depending on the response of the rest of the evaluators.
-
Count with each role (supervisors, colleagues, subordinates, clients) the number of responses equal to or higher than the required level. If there is a lower response for a role, you can consider that this role does not perceive the indicator as present in the person evaluated.
With the previously calculated column, it calculates if all the roles perceive the indicator as present in the evaluated, if so, it places the indicator in row 1, if not in row 2.
Once you have the results, it is time to analyze all the information and establish actions to make the most of the talent of your team. Of course, it will be key that Human Resources, or the supervisor himself, share the results with the person evaluated in order to establish a constructive dialogue and be able to analyze them together.
If you don't know where to start, in this post we can give you ideas of things you can do after a performance evaluation that you can also apply to the map of strengths and areas for improvement obtained.
And of course, if you want to see how easy it is to do this and other talent management processes with Hrider you just have to try it for yourself from our Free demo with no time limit.
4. Johari Window Quiz